ZeroIn™ (Beta)
ZeroIn™ is a knowledge graph that shows an overview of your environment, including endpoints, cloud, detections, and vulnerabilities. This guide will explain key sections of ZeroIn™ to help you understand and effectively use the tool.
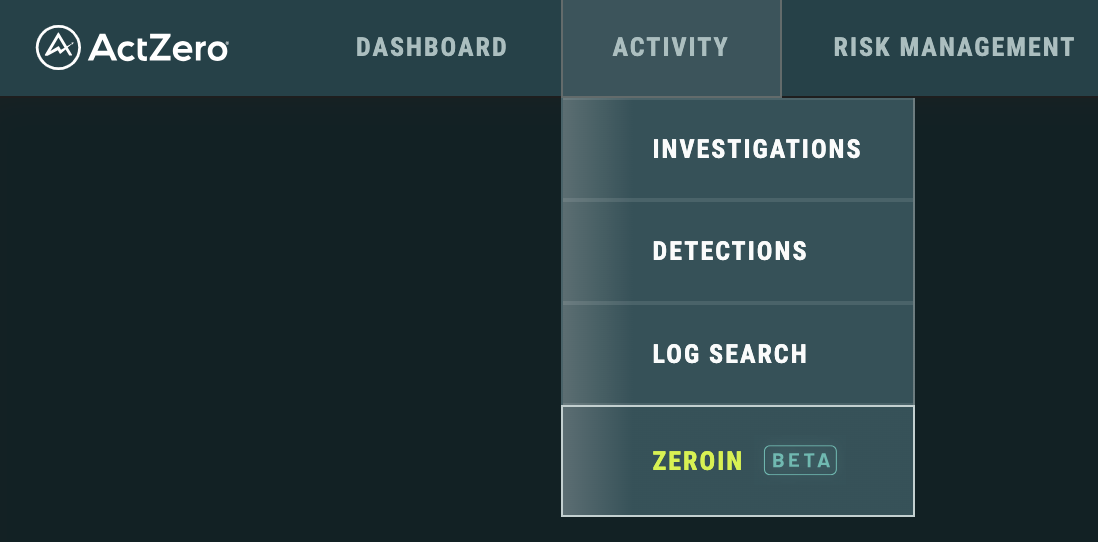
To view the dashboard, select ZEROIN from the ACTIVITY menu at the top.
Why/When should I use ZeroIn™?
-
Comprehensive Cybersecurity Solution: Leverages Generative AI and integrates diverse data sources for a complete security landscape overview.
-
Diverse Cyber Defense Tools: Offers a variety of tools to enhance defense capabilities against evolving cyber threats.
-
Gen AI-Driven Summaries and Search: Utilizes Generative AI to construct graph summaries, enabling quick and clear understanding of complex security events. Generative AI also allows users to ask questions in plain English instead of complex queries, streamlining the investigation process.
-
Proactive Extended Activity Focus: Capable of zeroing in on specific extended activities based on initial notifications from ActZero, facilitating proactive responses.
Understand and use the dashboard
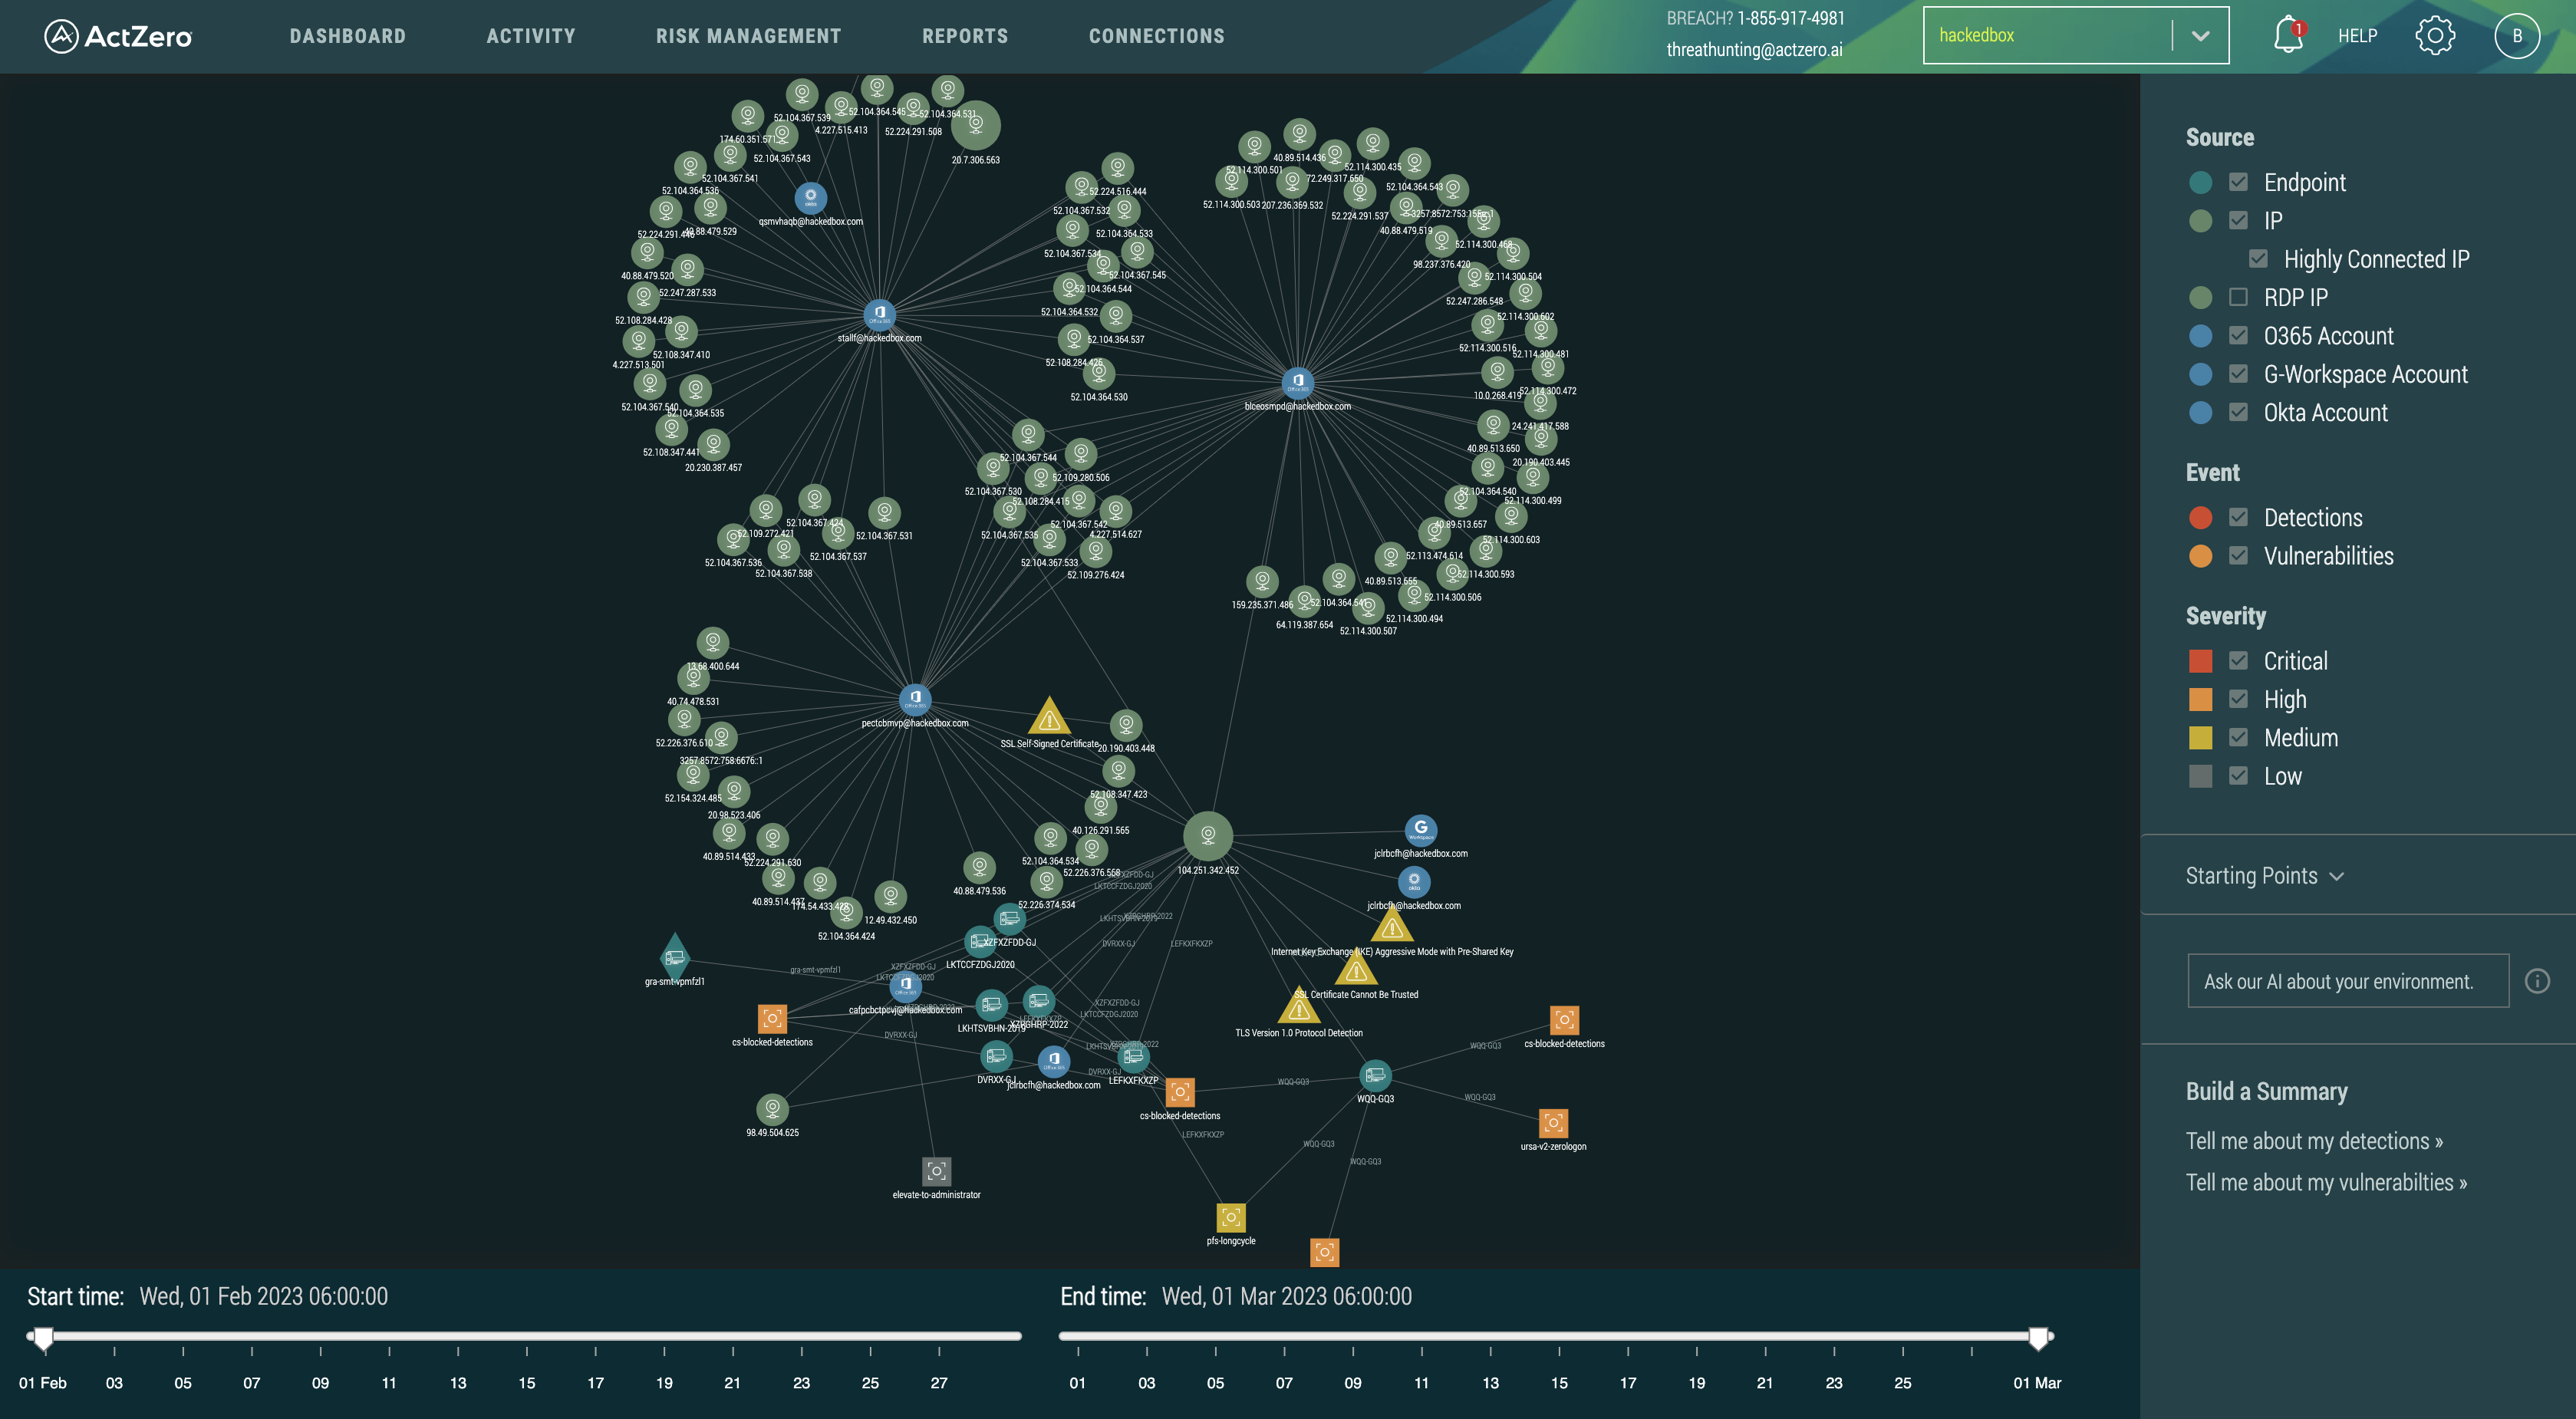
The graph is interactive - you can click on a node or an edge to see more details. Zoom in and out, or drag a node to reposition it. Use the time sliders at the bottom and filters on the right to narrow in on a specific timeframe or type of data.
The "Starting Points" menu provides some common questions and views if you're not sure what to look at first.
Understanding the "Ask a Question" Box

The goal of the "Ask our AI about your environment" box is to allow you to query the graph using natural language.
What kinds of things can I ask?
Examples of the types of questions you can ask are:
-
Show everything connected to "MY_ENDPOINT".
-
Show all endpoints containing "DC".
-
Show all cloud accounts containing "lastname" and what they are connected to.
-
Show all Okta detections.
-
Show anything with two or more detections.
The questions should be specific to the data in the graph. Asking "What is the capital of Antarctica?" won't return any graph data.
The questions should also be objective. The model doesn't provide advice or subjective opinions, so questions like "What should I do next?" that don't correspond to specific data won't generate a response.
How does it work?
Behind the box is a large language model, or LLM. When provided with specific instructions and a schema of the graph, it can generate queries to return data from the graph.
Understanding the "Build a Summary" Section
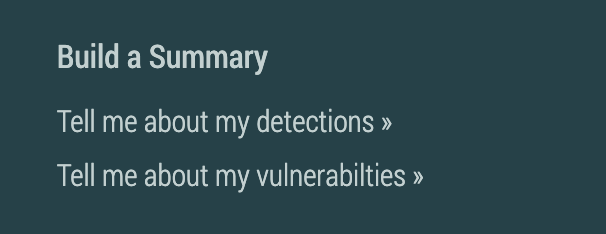
The goal of the "Build a Summary" buttons is to provide you with a concise summary of either detections or vulnerabilities in your environment. These summaries could, for example, be shared with any colleagues who prefer paragraphs to spreadsheets.
How does it work?
These buttons are also backed by a large language model (LLM). First data is retrieved from the graph database, and then an LLM is provided with detailed instructions on how to create a concise summary.
Is my data safe?
Yes. There has been a lot of buzz about model providers using user questions as training material. We don't send your data to be summarized by a public model - all data stays within ActZero's environment, with assurances that it will not be saved or used for future model training.
Why am I seeing a summary of only the most recent detections/vulnerabilities?
When there are many detections or vulnerabilities present within the last month, we've found that the resulting summaries can become vague or unhelpful. We therefore summarize only recent higher severity data to ensure the most useful summaries.
FAQs
Q: How often is the graph updated?
A: Basic data like endpoints or cloud logins are batch processed several times a day. Detections and vulnerabilities are streaming and should be added in near real time.
Q: Why might the AI-driven sections provide information that seems inaccurate?
A: The presentation of inaccurate data is a possibility, despite our best efforts to implement safeguards against it. It's important to note that the information being summarized comes directly from real data within the graph, which assists in mitigating the occurrence of inaccuracies. Additionally, it's worth mentioning that the current version of our system is in beta, and we are committed to ongoing improvements and refinements to enhance its reliability and accuracy.
Q: Are all the data sources that are being ingested available in the ZeroIn™ Graph?
A: No, the data available in the graph is from a subset of data sources we ingest. Currently the graph includes data from Crowdstrike-protected endpoints, Office 365, G-Workspace, and Okta, as well as any detections and vulnerabilities. We are working to add additional sources such as Defender, AWS Cloudtrail, and mobile data. Network data, however, is too voluminous to include in the graph and is best explored with our Log Management package.
Q: Can I see the data beyond the last 30 days?
A: Data in ZeroIn™ is limited to the last 30 days for performance reasons. If you have questions about data older than 30 days, please open a support case.
Q: Why don't I see tickets/investigations the "Events" filter?
A: Tickets are not currently incorporated into the graph, though adding them is on the roadmap. In the meantime, clicking "View Investigation" from the detail popup of a detection will link you to the Investigations page where you can see ticket details for the ticket corresponding to that detection.
Troubleshooting
-
For technical issues, and anything else not covered by this FAQ please get in touch with support.
-
For security questions and concerns please email our SOC.
Was this documentation helpful? Please send us your feedback!