Vulnerabilities Dashboard
The ActZero Vulnerabilities dashboard provides a comprehensive overview of vulnerabilities present in your environment. You can view historical data for any range in the last 12 months. This guide will break down each section of the dashboard to help you understand and effectively use the tool.
Dashboard results reflect the scan of the internal and external network based on the info provided during onboarding.
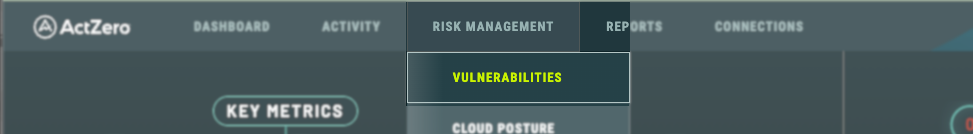
To view the dashboard, select VULNERABILITIES from the RISK MANAGEMENT menu at the top.
Understand and use the dashboard
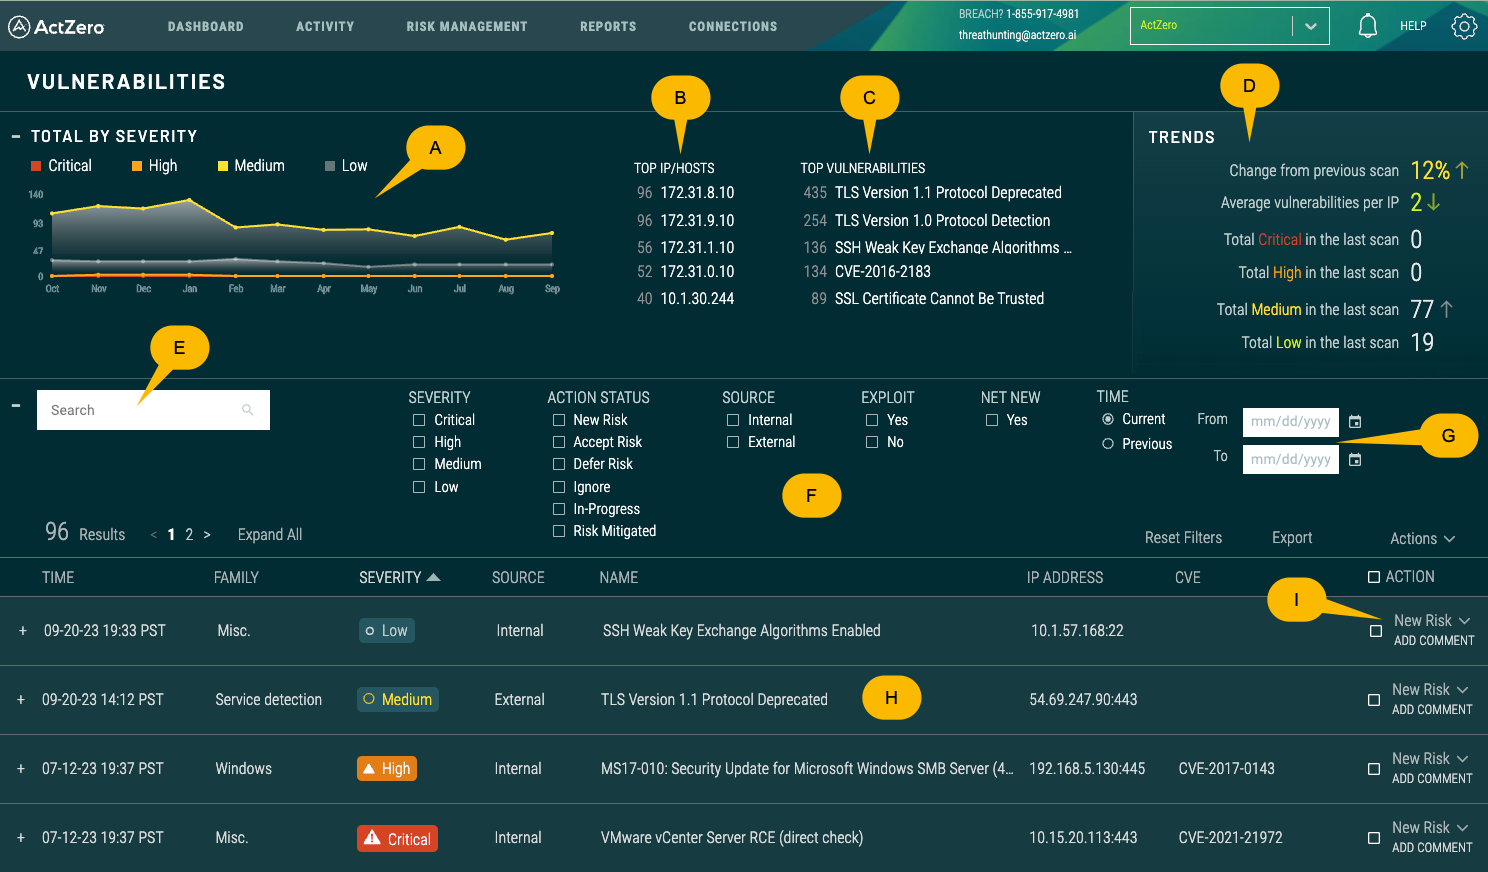
Total by Severity (A)
- This section provides a graphical representation of vulnerabilities over time based on their severity. The graph displays the number of vulnerabilities in categories: Critical, High, Medium, and Low.
- Hover over a point on the graph to see the exact count for a specific month.
- Adjust the time range selector (G) to change the range of dates. You can view historical data for any range in the last 12 months.
Top IP/Hosts (B)
Lists the IP addresses or hosts with the most vulnerabilities detected. IPs are ranked based on the number of vulnerabilities, allowing you to prioritize which systems need immediate attention.
Top Vulnerabilities (C)
Showcases the most prevalent vulnerabilities in your environment. The number next to each vulnerability indicates how many times that specific vulnerability was detected across all systems.
Trends (D)
Offers insights into how vulnerabilities are trending over time. Displays the percentage change from the previous scan, average vulnerabilities per IP, and the total number of vulnerabilities in each severity category from the last scan.
Search Bar (E)
Allows you to search for specific vulnerabilities or other related information.
Filters (F)
- Severity: filter vulnerabilities based on their severity.
- Action Status: filter based on the status of the action taken for a vulnerability (e.g., Accept Risk, Defer Risk, etc.).
- Source: differentiates vulnerabilities detected from internal sources versus external sources.
- Exploit: indicates whether an exploit exists for the vulnerability.
- Net New: shows if the vulnerability was detected in a previous scan or is new in the current scan. Note: this feature leverages IP addresses, and may reflect a "new" vulnerability if the device IP address has changed.
- Time: set a specific time range to display vulnerabilities.
Time Range Selector (G)
Allows you to set a custom date range for which you'd like to view vulnerability data.
Results Table (H)
Displays a list of vulnerabilities detected, including:
- time of detection
- type or family of vulnerability
- severity
- source (internal or external)
- name
- IP address where it was detected
- CVE (Common Vulnerabilities and Exposures) identifier
- action taken
Sort vulnerabilities by clicking on column headers.
Click "Expand All" to view detailed information about each vulnerability.
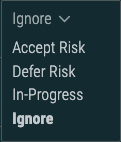
Add Comment & Action Dropdown (I)
For each vulnerability listed, you have the option to add a comment or change its action status using the dropdown. The dropdown offers the ability to accept a known risk, defer it, flag it as in progress, or ignore it altogether.
Troubleshooting
-
For technical issues, and anything else not covered by this FAQ please get in touch with support.
-
For security questions and concerns please email our SOC.
Was this documentation helpful? Please send us your feedback!